Beginner's Guide to the Hang Seng Index: Essential Introduction and Its Connection to the Hong Kong Economy


Image Source: pexels
The Hang Seng Index is often likened to the “thermometer” of the Hong Kong economy. It is a key score that tracks the performance of top companies listed on the Hong Kong Exchanges and Clearing Limited (HKEX). The real-time Hang Seng Index quotes that people see are precisely the dynamic readings of this “temperature.” As an important global financial center, Hong Kong has an enormous stock market scale.
| Entity | Market Capitalization (million USD) | Year |
|---|---|---|
| Hong Kong | 5,022,179 | 2025 |
| Global | 136,287,177 | 2025 |
Changes in this score directly reflect the market’s confidence in economic prospects.
Key Highlights
- The Hang Seng Index represents the Hong Kong stock market and reflects the overall health of the Hong Kong economy.
- The rise and fall of the Hang Seng Index can help us understand future trends in the Hong Kong economy.
- The financial and real estate sectors have a significant impact on the Hang Seng Index because they are crucial to the Hong Kong economy.
- Beginners can invest in the Hong Kong market by purchasing funds (ETFs) that track the Hang Seng Index.
- Understanding the Hang Seng Index can help investors better comprehend the market and make informed investment decisions.
What is the Hang Seng Index?
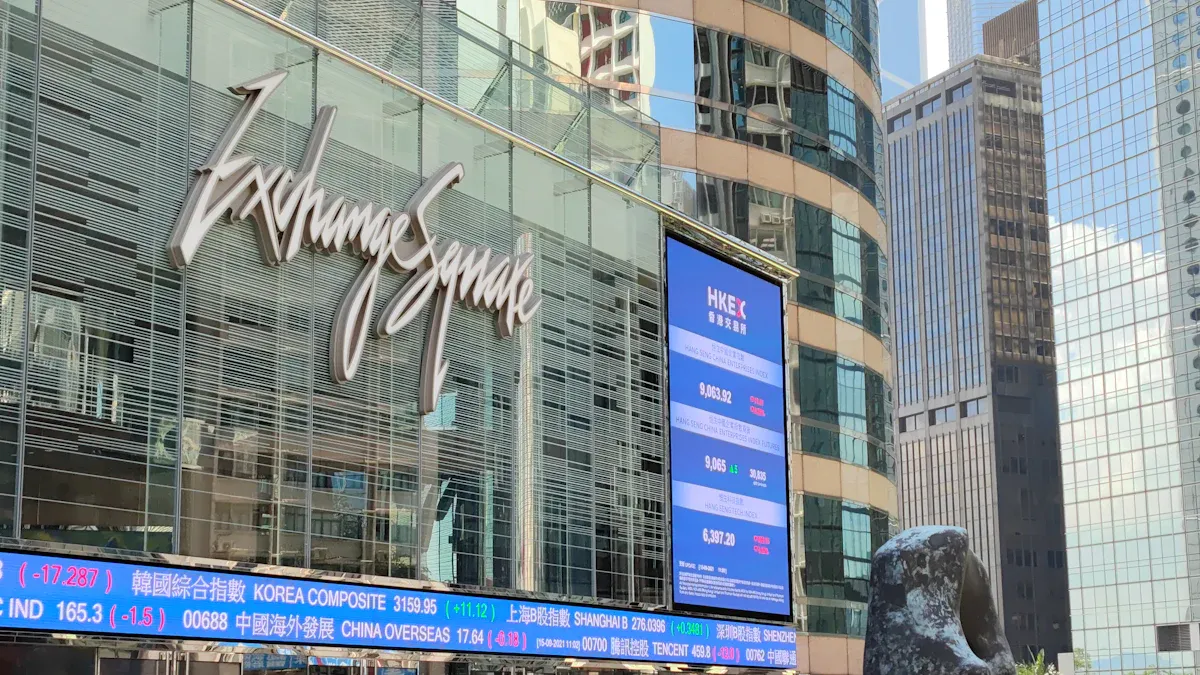
Image Source: unsplash
The Hang Seng Index is more than just a number; it is a carefully designed system to measure the overall health of the Hong Kong stock market. To truly understand this “thermometer,” we need to delve into its composition, calculation method, and its important position in the financial world.
Composition and History of the HSI
The history of the Hang Seng Index dates back to November 24, 1969. At that time, Hang Seng Bank launched it as a public service to provide the market with a reliable indicator. The index initially started with a base of 100 points and included 33 of the most representative companies.
Over time, the Hang Seng Index has continuously evolved to reflect changes in the Hong Kong economic structure.
- 1994: The index first included “red chip” stocks listed in Hong Kong but with primary operations in mainland China.
- 2006: The index began to include “H shares” registered in mainland China and listed in Hong Kong, such as China Construction Bank.
- 2021: Hang Seng Indexes Company announced a major reform, planning to gradually increase the number of constituent stocks to 100 to cover more industries.
Today, the Hang Seng Index constituents cover four core categories: commerce and industry, finance, utilities, and properties. These companies are leaders in their respective industries, and their performance collectively paints the overall picture of the Hong Kong market. Among them, some technology and financial giants occupy significant weights.
The table below shows some of the current leading companies by market capitalization in the Hang Seng Index, providing an intuitive view of the influence of these giant enterprises.
| Stock Name | Market Cap (USD) |
|---|---|
| Tencent Holdings Limited | 703B |
| Industrial and Commercial Bank of China Limited | 373B |
| Alibaba Group Holding Limited | 353B |
| China Construction Bank Corporation | 265B |
| HSBC Holdings plc | 243B |
| China Mobile Limited | 243B |
How is the Index Point Calculated?
You might wonder how the Hang Seng Index, often reported in the tens of thousands on TV news, is actually calculated?
The Hang Seng Index uses a method called free-float adjusted market capitalization weighting. In simple terms, the larger a company’s market capitalization and the more shares freely circulating in the market, the greater its “say” in the index, and the bigger the impact of its stock price changes on the overall index points.
Key Elements of Index Calculation
- Current Price of Constituents: Current price of the constituent stocks.
- Total Issued Share Capital of the Company: Total issued share capital of the company.
- Free-Float Adjustment Factor: Free-float adjustment factor, representing the proportion of shares available for public trading in the market.
- Weighting Cap Factor: Weighting cap factor, ensuring no single stock’s weight is too high to diversify risk.
To ensure the representativeness of the index, Hang Seng Indexes Company regularly screens constituent stocks. A company must meet strict criteria to be included in the index.
- Market Cap and Turnover: The company’s total market capitalization and total turnover must rank at the top of the market.
- Listing History: Usually requires at least 24 months of listing history, but for some extra-large new listings, this requirement can be shortened.
- Industry Representativeness: The company must also be an important representative in its industry.
Hang Seng Indexes Company reviews the constituents quarterly and makes necessary adjustments in March, June, September, and December each year to ensure the index continuously and accurately reflects the latest market dynamics.
Why is the HSI So Important?
The importance of the Hang Seng Index far exceeds Hong Kong locally. It is often called Asia’s Dow Jones Index and is an important barometer for international investors to observe Asian markets, especially the economic trends in mainland China.
A Global Performance Benchmark
For global fund managers and investors, the Hang Seng Index is a key performance benchmark. They compare their portfolio returns with the performance of the Hang Seng Index. If a fund focused on Asian markets outperforms the Hang Seng Index growth, it is generally considered to have achieved good results. Conversely, if it underperforms the index, adjustments to the investment strategy may be needed.
Its importance is reflected in the following aspects:
- Market Barometer: It is the most authoritative indicator for measuring the overall performance of the Hong Kong stock market.
- Investment Guide: Global investors use the HSI to assess the investment value and risks of the Hong Kong market and as an important reference for asset allocation.
- Basis for Derivatives: Many financial derivatives, such as index futures, options, and exchange-traded funds (ETFs), are designed and traded based on the Hang Seng Index.
In summary, with its long history, rigorous compilation method, and broad representativeness, the Hang Seng Index has become a core bridge connecting Hong Kong with global capital markets.
Linkage Between the HSI and the Hong Kong Economy

Image Source: pexels
The Hang Seng Index is not only a report card for the stock market; it is closely linked to Hong Kong’s overall economic activities, like a mirror reflecting the ups and downs of the economy. Understanding this linkage is key to grasping the deeper meaning behind the HSI.
How Does the Index Reflect Economic Conditions?
The rise and fall of the Hang Seng Index are usually seen as leading indicators of economic prospects. This association is mainly achieved through two channels: corporate earnings expectations and the wealth effect.
Two Transmitters of the Economy
- Corporate Earnings Expectations: The stock market embodies investors’ confidence in the future. When people are generally optimistic about economic prospects, they expect increased profits for listed companies (especially these leading enterprises in the index constituents). Investors are thus willing to buy stocks at higher prices, pushing the index upward. Conversely, if economic prospects are unclear, the index will fall.
- Wealth Effect: When the stock market rises, the assets of individuals and institutions holding stocks appreciate, making them feel “wealthier.” This feeling encourages increased consumption and investment. Increased consumption stimulates growth in retail, services, and other industries, ultimately promoting overall gross domestic product (GDP) growth.
In simple terms, a rising Hang Seng Index may signal that economic data in the coming months will look good. Persistent index weakness, on the other hand, could be a warning sign of economic slowdown or recession.
How Do Key Sectors Influence the Index?
The Hang Seng Index constituents are not “equal.” Some sectors with extremely high weights have a decisive influence on the index’s ups and downs. In Hong Kong, finance and real estate are two pivotal sectors.
- Finance: As an international financial center, Hong Kong’s banking, insurance, and securities industries are highly developed. The operations of these financial institutions are closely tied to the macroeconomy. During economic prosperity, corporate loan demand is strong, investment activities are frequent, financial institutions are highly profitable, and their stock prices naturally rise, driving the HSI higher.
- Real Estate: Real estate is another pillar of the Hong Kong economy. Large real estate developers occupy considerable weights in the Hang Seng Index. Therefore, the prosperity of the Hong Kong property market is directly linked to the index’s performance. When the property market is booming, real estate stocks soar, powerfully pushing up the HSI. Conversely, when market expectations reverse, investors taking profits in high-growth real estate sectors often trigger significant index pullbacks.
The case of China Evergrande Group is a microcosm. This company was once China’s top real estate developer, and its listing in Hong Kong was the largest among mainland private developers at the time. However, as it fell into a debt crisis exceeding $300 billion and eventually delisted in Hong Kong, it marked the end of an era. Evergrande’s collapse was not only its own failure but also symbolized the difficulties of the entire industry, having a profound impact on the Hong Kong stock market.
- The Hang Seng Index, from its 2018 high, once fell more than 50%.
- The index level once retreated to near the lows of the 2008 global financial crisis.
- Evergrande, once one of the world’s highest market cap real estate companies, saw its stock price fall more than 99% in just a few years.
Synchronous Performance in Historical Events
Looking back at history, during major economic events, the Hang Seng Index’s trends have almost always been synchronous with Hong Kong economic data. This provides the most intuitive evidence.
1997 Asian Financial Crisis
This crisis swept across Asia, and Hong Kong was not spared. The Hang Seng Index suffered heavy losses during this period, and the economy subsequently fell into a trough.
| Crisis Type | Hang Seng Index Percentage Change |
|---|---|
| 1997 Asian Financial Crisis | -53% |
The index plunged from over 13,000 points at the beginning of 1997 under speculative attacks, dropping to about 7,000 points by the third quarter of 1998. The stock market collapse quickly transmitted to the real economy, with unemployment rate soaring.
| Year | Unemployment Rate |
|---|---|
| 1997 | 2.2% |
| 2003 | 7.9% |
2008 Global Financial Crisis
The global financial tsunami triggered by the U.S. subprime crisis similarly struck Hong Kong as an open economy. The Hang Seng Index experienced another cliff-like drop.
| Crisis Type | Hang Seng Index Percentage Change |
|---|---|
| 2008 Global Financial Crisis | -53% |
The violent stock market fluctuations reflected extreme market panic over global economic recession. This panic was soon validated in Hong Kong’s economic data, with GDP turning from positive to negative and unemployment rising sharply.
| Indicator | 2008 | 2009 |
|---|---|---|
| GDP Growth Rate | 2.3% | -2.6% |
| Unemployment Rate | 3.4% (August) | 5.4% (May-July) |
These historical cases clearly show that dramatic fluctuations in the Hang Seng Index are often direct reflections of major changes in economic fundamentals. It acts like a sensitive sensor, capturing and amplifying “danger signals” in the economic environment in advance.
How Can Beginners Apply the Hang Seng Index?
After understanding the Hang Seng Index, beginner investors can learn how to apply it to observe the market. This is not just about reading a string of numbers but cultivating insight into the economic environment.
How to Interpret Daily Market Fluctuations?
Daily market fluctuations are normal. Investors need to distinguish short-term noise from long-term trends. Geopolitical news, such as changes in U.S.-China trade relations, can cause dramatic short-term fluctuations in real-time Hang Seng Index quotes. Reports indicate that on the day tariffs were announced, the Hang Seng Index once fell nearly 5%.
For deeper analysis, professionals often use technical indicators to interpret real-time Hang Seng Index charts.
| Indicator | Explanation |
|---|---|
| Moving Average | Smooths price fluctuations by calculating the average price over a period, helping identify trend direction. |
| Relative Strength Index (RSI) | Used to determine if the market is in “overbought” or “oversold” condition; high values may signal pullback risk. |
| Moving Average Convergence Divergence (MACD) Oscillator | Shows the strength of market momentum. Positive values usually indicate bullish momentum, negative values indicate bearish momentum. |
These tools can help investors more objectively judge the trend of real-time Hang Seng Index quotes.
How to View Real-Time Hang Seng Index Quotes?
Accessing the latest real-time Hang Seng Index quotes is very convenient. There are now many professional financial websites and mobile apps that provide this service.
Common Tools
Investors can view real-time Hang Seng Index quotes anytime, anywhere through platforms like Biyapay, TradingView, AAStocks, and others. These tools not only provide real-time quotes and charts but also integrate related news and technical analysis to help users make more comprehensive judgments.
These platforms usually provide detailed bid/ask prices, rise/fall percentages, and high/low points, serving as powerful assistants for monitoring market dynamics.
Common Ways to Invest in the HSI
For ordinary investors, the main common ways to directly invest in the Hang Seng Index are exchange-traded funds (ETFs) and index futures/options.
- Exchange-Traded Funds (ETFs) This is a simple and direct way. Investors can purchase ETFs that track the Hang Seng Index performance. Among them, the Tracker Fund of Hong Kong (code: 2800.HK) is the most famous one. It was established in 1999, aiming to replicate the Hang Seng Index performance, allowing investors to invest in all index constituents at once like buying a single stock.
- Index Futures and Options These are financial derivatives with more complex trading and higher risks. Hang Seng Index futures contracts are traded in index points, with each point valued at HK$50. Such instruments carry leverage and may result in losses exceeding the initial margin, so they are not suitable for all investors. Trading requires full understanding of contract rules and potential risks.
For beginners, opening a securities account with a licensed bank or broker in Hong Kong and purchasing ETFs tracking real-time Hang Seng Index quotes is a relatively safe first step to participate in the market.
The Hang Seng Index is far more than a string of jumping numbers; it is an important window for ordinary people to observe the health of the Hong Kong economy. Investors should not be swayed by short-term market fluctuations but learn to use this tool to more rationally understand the broader economic environment.
Famous investor Warren Buffett once said: “The stock market is designed to transfer money from the active to the patient.”
This reminds people that a long-term perspective is more important than chasing daily rises and falls. Starting today, begin paying attention to the Hang Seng Index like checking the weather forecast!
FAQ
What is the difference between the Hang Seng Index and the Shanghai Composite Index?
The Hang Seng Index tracks companies listed in Hong Kong, including international and mainland Chinese enterprises. The Shanghai Composite Index tracks companies listed on the Shanghai Stock Exchange, mainly reflecting the performance of mainland China’s A-share market. The two differ in market composition and pricing currency.
What are red chip stocks and H shares?
- H Shares: Refer to stocks of companies registered in mainland China and listed in Hong Kong.
- Red Chip Stocks: Refer to stocks of companies with primary operations in mainland China but registered overseas and listed in Hong Kong.
Both are important components of the Hang Seng Index, reflecting the close ties between mainland China’s economy and the Hong Kong market.
Does an index decline necessarily mean the economy is bad?
Not necessarily. Short-term declines may be influenced by market sentiment or specific events. But prolonged sustained declines usually reflect investors’ concerns about economic fundamentals. Investors should make comprehensive judgments combining long-term trends and macroeconomic data, avoiding overinterpreting single-day fluctuations.
Can individuals directly buy and sell the Hang Seng Index?
Individuals cannot directly buy and sell the index itself because it is just a numerical value. Investors can invest in its performance by purchasing exchange-traded funds (ETFs) tracking the Hang Seng Index or participating in related index futures, options, and other derivatives.
*This article is provided for general information purposes and does not constitute legal, tax or other professional advice from BiyaPay or its subsidiaries and its affiliates, and it is not intended as a substitute for obtaining advice from a financial advisor or any other professional.
We make no representations, warranties or warranties, express or implied, as to the accuracy, completeness or timeliness of the contents of this publication.
Related Blogs of

US Stock Market Holiday Countdown: How Investors Should Position for Next Week's Trading


Micro Dow, Micro Nasdaq, Micro S&P Futures Comprehensive Comparison – Helping You Find the Best Trading Choice


A Blessing for Small Investors: Finding the Lowest Trading Cost US Stock Brokers


Is the W-8BEN Form Required for Opening a US Stock Account? Understand How to Save on Taxes in One Article

Choose Country or Region to Read Local Blog

Contact Us


BIYA GLOBAL LLC is a licensed entity registered with the U.S. Securities and Exchange Commission (SEC No.: 802-127417); a certified member of the Financial Industry Regulatory Authority (FINRA) (Central Registration Depository CRD No.: 325027); regulated by the Financial Industry Regulatory Authority (FINRA) and the U.S. Securities and Exchange Commission (SEC).
BIYA GLOBAL LLC is registered with the Financial Crimes Enforcement Network (FinCEN), an agency under the U.S. Department of the Treasury, as a Money Services Business (MSB), with registration number 31000218637349, and regulated by the Financial Crimes Enforcement Network (FinCEN).
BIYA GLOBAL LIMITED is a registered Financial Service Provider (FSP) in New Zealand, with registration number FSP1007221, and is also a registered member of the Financial Services Complaints Limited (FSCL), an independent dispute resolution scheme in New Zealand.